Menu
▾
▴
gnuplot-info — For questions and discussion about gnuplot
You can subscribe to this list here.
| 2003 |
Jan
|
Feb
|
Mar
|
Apr
|
May
|
Jun
|
Jul
|
Aug
|
Sep
|
Oct
(2) |
Nov
(2) |
Dec
|
|---|---|---|---|---|---|---|---|---|---|---|---|---|
| 2004 |
Jan
(3) |
Feb
(1) |
Mar
(2) |
Apr
(22) |
May
(52) |
Jun
(43) |
Jul
(36) |
Aug
(59) |
Sep
(37) |
Oct
(55) |
Nov
(39) |
Dec
(36) |
| 2005 |
Jan
(64) |
Feb
(40) |
Mar
(62) |
Apr
(58) |
May
(256) |
Jun
(77) |
Jul
(80) |
Aug
(39) |
Sep
(56) |
Oct
(36) |
Nov
(113) |
Dec
(68) |
| 2006 |
Jan
(43) |
Feb
(64) |
Mar
(69) |
Apr
(60) |
May
(71) |
Jun
(53) |
Jul
(63) |
Aug
(63) |
Sep
(76) |
Oct
(85) |
Nov
(82) |
Dec
(73) |
| 2007 |
Jan
(75) |
Feb
(82) |
Mar
(84) |
Apr
(104) |
May
(67) |
Jun
(101) |
Jul
(107) |
Aug
(138) |
Sep
(128) |
Oct
(106) |
Nov
(112) |
Dec
(112) |
| 2008 |
Jan
(94) |
Feb
(87) |
Mar
(146) |
Apr
(169) |
May
(75) |
Jun
(26) |
Jul
(26) |
Aug
(7) |
Sep
(18) |
Oct
(53) |
Nov
(42) |
Dec
(19) |
| 2009 |
Jan
(43) |
Feb
(39) |
Mar
(18) |
Apr
(45) |
May
(66) |
Jun
(87) |
Jul
(56) |
Aug
(41) |
Sep
(56) |
Oct
(139) |
Nov
(98) |
Dec
(88) |
| 2010 |
Jan
(81) |
Feb
(79) |
Mar
(83) |
Apr
(97) |
May
(124) |
Jun
(84) |
Jul
(53) |
Aug
(85) |
Sep
(89) |
Oct
(50) |
Nov
(98) |
Dec
(78) |
| 2011 |
Jan
(97) |
Feb
(74) |
Mar
(68) |
Apr
(54) |
May
(63) |
Jun
(59) |
Jul
(65) |
Aug
(58) |
Sep
(37) |
Oct
(40) |
Nov
(59) |
Dec
(35) |
| 2012 |
Jan
(16) |
Feb
(56) |
Mar
(63) |
Apr
(25) |
May
(48) |
Jun
(58) |
Jul
(20) |
Aug
(13) |
Sep
(43) |
Oct
(35) |
Nov
(20) |
Dec
(17) |
| 2013 |
Jan
(22) |
Feb
(11) |
Mar
(51) |
Apr
(34) |
May
(57) |
Jun
(27) |
Jul
(70) |
Aug
(30) |
Sep
(38) |
Oct
(53) |
Nov
(40) |
Dec
(25) |
| 2014 |
Jan
(26) |
Feb
(35) |
Mar
(60) |
Apr
(12) |
May
(17) |
Jun
(15) |
Jul
(9) |
Aug
(18) |
Sep
(46) |
Oct
(18) |
Nov
(19) |
Dec
(15) |
| 2015 |
Jan
(17) |
Feb
(28) |
Mar
(21) |
Apr
(54) |
May
(36) |
Jun
(8) |
Jul
(30) |
Aug
(13) |
Sep
(3) |
Oct
(28) |
Nov
(3) |
Dec
(3) |
| 2016 |
Jan
(11) |
Feb
(9) |
Mar
(29) |
Apr
(10) |
May
(8) |
Jun
(5) |
Jul
(50) |
Aug
(57) |
Sep
(13) |
Oct
(5) |
Nov
(17) |
Dec
(11) |
| 2017 |
Jan
(3) |
Feb
(23) |
Mar
(16) |
Apr
(7) |
May
(15) |
Jun
(12) |
Jul
(48) |
Aug
(15) |
Sep
(3) |
Oct
(20) |
Nov
(28) |
Dec
(21) |
| 2018 |
Jan
(13) |
Feb
(21) |
Mar
(21) |
Apr
(7) |
May
(3) |
Jun
(7) |
Jul
(27) |
Aug
(38) |
Sep
(4) |
Oct
(30) |
Nov
(22) |
Dec
|
| 2019 |
Jan
(5) |
Feb
(16) |
Mar
(1) |
Apr
(9) |
May
(7) |
Jun
(20) |
Jul
(13) |
Aug
(3) |
Sep
(2) |
Oct
(2) |
Nov
(2) |
Dec
(4) |
| 2020 |
Jan
(6) |
Feb
(11) |
Mar
(1) |
Apr
(18) |
May
(4) |
Jun
(5) |
Jul
(12) |
Aug
(1) |
Sep
(3) |
Oct
(7) |
Nov
(1) |
Dec
(17) |
| 2021 |
Jan
(1) |
Feb
(11) |
Mar
(16) |
Apr
(6) |
May
(5) |
Jun
(1) |
Jul
(1) |
Aug
(2) |
Sep
(8) |
Oct
(10) |
Nov
(4) |
Dec
(4) |
| 2022 |
Jan
(9) |
Feb
(35) |
Mar
(4) |
Apr
|
May
(3) |
Jun
(49) |
Jul
(11) |
Aug
|
Sep
(5) |
Oct
(2) |
Nov
(16) |
Dec
(13) |
| 2023 |
Jan
|
Feb
(8) |
Mar
(3) |
Apr
|
May
(8) |
Jun
|
Jul
(5) |
Aug
|
Sep
|
Oct
(2) |
Nov
|
Dec
(2) |
| 2024 |
Jan
(6) |
Feb
(9) |
Mar
|
Apr
(26) |
May
(24) |
Jun
|
Jul
(4) |
Aug
(2) |
Sep
(1) |
Oct
(10) |
Nov
(9) |
Dec
|
| 2025 |
Jan
|
Feb
(22) |
Mar
|
Apr
(1) |
May
|
Jun
|
Jul
|
Aug
|
Sep
(1) |
Oct
(1) |
Nov
|
Dec
(4) |
| 2026 |
Jan
|
Feb
(24) |
Mar
(20) |
Apr
(13) |
May
|
Jun
|
Jul
|
Aug
|
Sep
|
Oct
|
Nov
|
Dec
|
|
From: theozh <th...@gm...> - 2022-06-23 19:28:38
|
Please read `help colorspec` carefully. This would be one valid option of many options: green = "#00009600" set title font "verdana,12" tc rgbcolor green "hits \\@ https://dataswamp.org/\\~$USER" Am 23.06.2022 um 09:39 schrieb Emanuel Berg: > Why doesn't this work and how should you put it? > > green = "#00009600" > # ... > set title font "verdana,12" tc green "hits \\@ https://dataswamp.org/\\~$USER" > > It says the "colorspec option not recognized." at "green" on the last line. > > https://dataswamp.org/~incal/hits/hits.gpi > https://dataswamp.org/~incal/hits/hits.png > |
|
From: Norwid B. <nb...@ya...> - 2022-06-23 12:33:44
|
Emanuel Berg <in...@da...> wrote:
>
> Brilliant,
>
> set format y "%.0f"
> set ytics add (0 0, \
> "1M" 1000000, \
> "2M" 2000000, \
> "4M" 4000000, \
> "6M" 6000000, \
> "8M" 8000000, \
> "10M" 10000000, \
> "12M" 12000000, \
> "14M" 14000000)
>
> works!
>
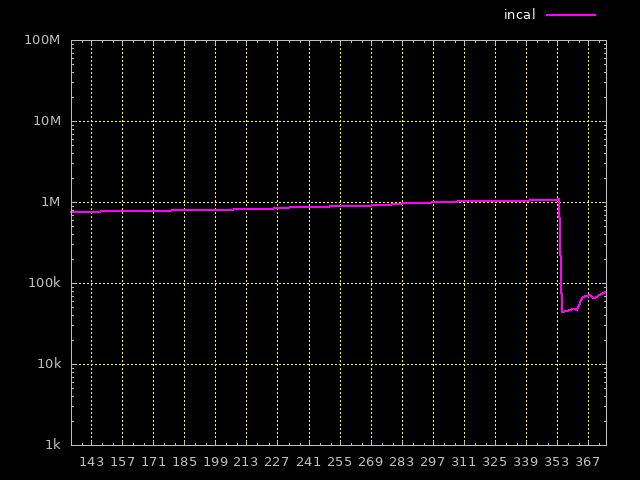
With the data available (and because the question is interesting), two
additional comments:
+ you may ease managing user-defined tics with exponential notation
like e.g., in Fortran:
```
set format y "%.0f"
set ytics font "verdana,10" add \
( 0 0, \
"1M" 1e06, \
"2M" 2e06, \
"4M" 4e06, \
"6M" 6e06, \
"8M" 8e06, \
"10M" 1e07, \
"12M" 1.2e7, \
"14M" 1.4e7)
```
+ gnuplot actually may add SI prefixes (k, M, etc.) on the scales for
you and show user-defined tics. For this to happen, drop "set
format y "%.0f" to try instead
```
set format y '%.0s %c'
set ytics font "verdana,10" add \
("25 M" 2.5e7) # only shown for the ordinate scaling by lg
set logscale y # i.e., the implicit form of "set logscale y 10"
```
The plot then retains an obvious hint something happened to
"katzeilla" and "rjc" during the first interval of recording while
the relative variation of the other traces was smaller. Credit to
stackoverflow user Christoph for the showcase[1] about the
alternative format.
Perhaps altogether with an instruction like "set yrange[1000:1e9]"
this may justify to move/reorganize the keys a little bit.
[1]
https://stackoverflow.com/questions/25123624/gnuplot-y-axis-format-convert-bytes-to-megabytes/25125788#25125788
|
|
From: Emanuel B. <in...@da...> - 2022-06-23 07:39:48
|
Why doesn't this work and how should you put it? green = "#00009600" # ... set title font "verdana,12" tc green "hits \\@ https://dataswamp.org/\\~$USER" It says the "colorspec option not recognized." at "green" on the last line. https://dataswamp.org/~incal/hits/hits.gpi https://dataswamp.org/~incal/hits/hits.png -- underground experts united https://dataswamp.org/~incal |
|
From: Emanuel B. <in...@da...> - 2022-06-23 07:22:57
|
>> You simply have to set the linecolor and textcolor of all >> the other objects, e.g. borders, labels, tics, etc. >> to "white". > > How do you set the size of the numbers for the y-axis? ytics Getting the hang of it :) -- underground experts united https://dataswamp.org/~incal |
|
From: Emanuel B. <in...@da...> - 2022-06-23 07:11:29
|
theozh wrote: > You simply have to set the linecolor and textcolor of all > the other objects, e.g. borders, labels, tics, etc. > to "white". How do you set the size of the numbers for the y-axis? This set ylabel font "verdana,11" doesn't seem to take. -- underground experts united https://dataswamp.org/~incal |
|
From: Emanuel B. <in...@da...> - 2022-06-23 07:02:29
|
Norwid Behrnd via gnuplot-info wrote:

> set ytics 10
> set mytics 10
>
> set ytics add ( "1 kb" 1000, \
> "10 kb" 10000, \
> "100 kb" 100000,\
> "1 mb" 1000000, \
> "10 mb" 10000000,\
> "100 mb" 100000000,\
> "1 gb" 1000000000, \
> "10 gb" 10000000000.0,\
> "100 gb" 100000000000.0,\
> "1 tb" 1000000000000.0, \
> "10 tb" 10000000000000.0, \
> "100 tb" 100000000000000.0, \
> "1 pb" 1000000000000000.0, \
> "10 pb" 10000000000000000.0 )

Brilliant,

set format y "%.0f"
set ytics add (0           0, \
               "1M"  1000000, \
               "2M"  2000000, \
               "4M"  4000000, \
               "6M"  6000000, \
               "8M"  8000000, \
              "10M" 10000000, \
              "12M" 12000000, \
              "14M" 14000000)

works!

https://dataswamp.org/~incal/hits/hits.gpi
https://dataswamp.org/~incal/hits/hits.png

--
underground experts united
https://dataswamp.org/~incal
|
|
From: Emanuel B. <in...@da...> - 2022-06-23 06:53:22
|
theozh wrote: >>> You can also read the docs. In gnuplot console type: help >>> borders, help xtics, etc.. One example hint: `set border >>> lc "white" >> >> Thanks but for the key and title lc is an "unknown key >> option"? > > Please read the documentation of `help key` and `help > title`. There is an option "textcolor" or "tc" Ah, now I understand where the console is. In the console! Thanks, that did it! Now just some polishing and trying-out with the colors and all set :) https://dataswamp.org/~incal/hits/hits.gpi https://dataswamp.org/~incal/hits/hits.png -- underground experts united https://dataswamp.org/~incal |
|
From: Emanuel B. <in...@da...> - 2022-06-23 06:34:11
|
Ethan Merritt wrote:

> A correction, sorry. I meant to say the standard "C" local
> does not use a special character for the thousands
> separator. That is the default for gnuplot. en_US locale
> uses a comma. fr_FR uses a space.
>
> set decimal locale 'fr_FR.UTF-8'
> FR = sprintf("%'.2f", A)
> print "FR format is ", FR
> Output:
>
> decimal_sign in locale is .
> decimal_sign in locale is ,
> US format is  1,234,567.89
> FR format is  1 234 567,89

Thanks for the explanation and example, I get it, but I'm not
getting it to work.

First, for me it says "decimal sign in locale is ." after
I set it to French; and after that it's still 14000000, i.e.
no grouping.

14M would be optimal IMO but 14 000 000 much better than
14000000 and "good enough for government work" I guess.

--
underground experts united
https://dataswamp.org/~incal
|
|
From: theozh <th...@gm...> - 2022-06-23 04:06:48
|
> You simply have to set the linecolor and textcolor of all the other objects, e.g. borders, labels, tics, etc. to "white". Please read the documentation of `help key` and `help title`. There is an option "textcolor" or "tc" Am 23.06.2022 um 03:47 schrieb Emanuel Berg: > theozh wrote: > >> You can also read the docs. >> In gnuplot console type: help borders, help xtics, etc.. >> One example hint: `set border lc "white" > > Thanks but for the key and title lc is an "unknown key > option"? > |
|
From: Ethan M. <eam...@gm...> - 2022-06-23 03:44:57
|
On Wednesday, 22 June 2022 20:25:53 PDT Ethan Merritt wrote:
> On Wednesday, 22 June 2022 18:41:52 PDT Emanuel Berg wrote:
> > >> you might want to try "%0'.f" or "%'0.f" (whichever you
> > >> find easier to read).
> > >
> > > What does that apostrophe do?
> >
> > Grouping. Don't know if that's supported or why it doesn't
> > work. But OK.
>
> The thousands separator format is sensitive to the current locale.
> I do not know of any way to set is separately; only as one component
> of a full numerical locale.  Standard US practice does not use a special
> character for this purpose, so the standard US locale ignores the aposrophe
> in a format.

A correction, sorry.
I meant to say the standard "C" local does not use a special character
for the thousands separator.  That is the default for gnuplot.
en_US locale uses a comma.  fr_FR uses a space.

	Ethan

> Other locales do provide one, however.
>
> Here is an example of how you can use this in gnuplot:
> Script:
>
> A = 1234567.89
>
> set decimal locale 'en_US.UTF-8'
> US = sprintf("%'.2f", A)
> print "US format is ", US
>
> set decimal locale 'fr_FR.UTF-8'
> FR = sprintf("%'.2f", A)
> print "FR format is ", FR
> Output:
>
> decimal_sign in locale is .
> decimal_sign in locale is ,
> US format is  1,234,567.89
> FR format is  1 234 567,89
>
> 	Ethan
>
>
|
|
From: Ethan M. <eam...@gm...> - 2022-06-23 03:26:06
|
On Wednesday, 22 June 2022 18:41:52 PDT Emanuel Berg wrote:
> >> you might want to try "%0'.f" or "%'0.f" (whichever you
> >> find easier to read).
> >
> > What does that apostrophe do?
>
> Grouping. Don't know if that's supported or why it doesn't
> work. But OK.

The thousands separator format is sensitive to the current locale.
I do not know of any way to set is separately; only as one component
of a full numerical locale.  Standard US practice does not use a special
character for this purpose, so the standard US locale ignores the aposrophe
in a format.   Other locales do provide one, however.

Here is an example of how you can use this in gnuplot:
Script:

A = 1234567.89

set decimal locale 'en_US.UTF-8'
US = sprintf("%'.2f", A)
print "US format is ", US

set decimal locale 'fr_FR.UTF-8'
FR = sprintf("%'.2f", A)
print "FR format is ", FR
Output:

decimal_sign in locale is .
decimal_sign in locale is ,
US format is  1,234,567.89
FR format is  1 234 567,89

	Ethan
|
|
From: Emanuel B. <in...@da...> - 2022-06-23 01:47:50
|
theozh wrote: > You can also read the docs. > In gnuplot console type: help borders, help xtics, etc.. > One example hint: `set border lc "white" Thanks but for the key and title lc is an "unknown key option"? -- underground experts united https://dataswamp.org/~incal |
|
From: Emanuel B. <in...@da...> - 2022-06-23 01:42:12
|
>> you might want to try "%0'.f" or "%'0.f" (whichever you >> find easier to read). > > What does that apostrophe do? Grouping. Don't know if that's supported or why it doesn't work. But OK. -- underground experts united https://dataswamp.org/~incal |
|
From: Emanuel B. <in...@da...> - 2022-06-23 01:10:36
|
James Cloos wrote: > man 3 printf > would be a useful doc to read. Not mentioned (?) but this: numfmt --format="%.f" --round=nearest --to=si HITS e.g. $ numfmt --format="%.f" --round=nearest --to=si 123000000 123M > you might want to try "%0'.f" or "%'0.f" (whichever you find > easier to read). What does that apostrophe do? -- underground experts united https://dataswamp.org/~incal |
|
From: mark_at_yahoo <mar...@ya...> - 2022-06-22 18:56:13
|
On 6/22/22 10:59 AM, theozh wrote:
> You simply have to set the linecolor and textcolor of all the other
> objects, e.g. borders, labels, tics, etc. to "white".

I have a similar, long-standing problem if you have the time to consider
it. I've done all the above and they work perfectly, with the exception
of the "drag rectangle to define new zoom region". I've tried but never
succeeded in changing that from its default dark blue color, which is
almost invisible on a black background.

I believe I'm using the default "qt" terminal. It won't accept a
"background" argument in `set terminal` so instead I've been doing:

     set object 1 rectangle from screen 0,0 to screen 1,1 fillcolor rgb
"black" behind

The example code in the StackOverflow link you posted (thanks!) using
`set terminal wxt ...` works better -- the rectangle is light-colored
and visible -- but the text with the coordinates of the rectangle is
still a dark color and unreadable.

Is there a way to change the color of all of these interactive
mouse-feedback elements in addition to the plot graphics? Thanks in
advance for any suggestions.
|
|
From: theozh <th...@gm...> - 2022-06-22 18:15:18
|
Please read and study the answer in detail to that linked question! You can also read the docs. In gnuplot console type: help borders, help xtics, etc.. One example hint: `set border lc "white" Am 22.06.2022 um 20:09 schrieb Emanuel Berg: > theozh wrote: > >> You simply have to set the linecolor and textcolor of all the >> other objects, e.g. borders, labels, tics, etc. to "white". > > Yes but _how_? This is what I'm asking. > >> https://stackoverflow.com/questions/72668058 > > ? > |
|
From: Emanuel B. <in...@da...> - 2022-06-22 18:10:20
|
theozh wrote: > You simply have to set the linecolor and textcolor of all the > other objects, e.g. borders, labels, tics, etc. to "white". Yes but _how_? This is what I'm asking. > https://stackoverflow.com/questions/72668058 ? -- underground experts united https://dataswamp.org/~incal |
|
From: theozh <th...@gm...> - 2022-06-22 17:59:50
|
You simply have to set the linecolor and textcolor of all the other objects, e.g. borders, labels, tics, etc. to "white". See, e.g. https://stackoverflow.com/questions/72668058 Am 22.06.2022 um 08:56 schrieb Emanuel Berg: > How do I get a bright-on-theme? I did 'set term png background > rgb 'black'' but then how do I do everything else bright? > > TIA > > https://dataswamp.org/~incal/hits/hits.dat > https://dataswamp.org/~incal/hits/hits.gpi > https://dataswamp.org/~incal/hits/hits.png |
|
From: Emanuel B. <in...@da...> - 2022-06-22 17:00:15
|
Norwid Behrnd via gnuplot-info wrote: > Based on the preview shared with simultaneous presence of > lower-level (trace rjc; incal and lich) and higher-level > data (trace solene), a plot substituting y by its > transformation into lg(y) or sqrt(y) may be worth > a consideration. Okay, cool, later tho - but this reminds me of another problem which I got only at the gnuplot step, namely (ha) those usernames are hard-coded! But they are known up until then so how do I make gnuplot know about it as well, pass it to gnuplot if you will? -- underground experts united https://dataswamp.org/~incal |
|
From: Emanuel B. <in...@da...> - 2022-06-22 16:54:20
|
James Cloos wrote: >> I have 'set format y "%0.f"', so I get, e.g. 12000000, >> I would > > man 3 printf > would be a useful doc to read. OK ... I'll be back ... > you might want to try "%0'.f" or "%'0.f" (whichever you find > easier to read). Thanks, but to me all three looks the same? -- underground experts united https://dataswamp.org/~incal |
|
From: Emanuel B. <in...@da...> - 2022-06-22 16:45:14
|
Norwid Behrnd via gnuplot-info wrote: >> How do I get a bright-on-theme? I did 'set term png >> background rgb 'black'' but then how do I do everything >> else bright? > > Like "black", there is "white", i.e. an instruction like > > set term pngcairo background rgb "white" As you see I've successfully set the background to gray, a compromise where the black lines of everything else is still visible. However I'd like to set the background to black. I happens the same way but how do I then set everything else to bright color(s) so they are still visible? This was once known as a bright-on-black theme, now it seems it is called "dark mode". But that's what I desire anyway :) If you know how to achieve it? -- underground experts united https://dataswamp.org/~incal |
|
From: Norwid B. <nb...@ya...> - 2022-06-22 15:23:46
|
>>>>> "EB" == Emanuel Berg <in...@da...> writes: EB> I have 'set format y "%0.f"', so I get, e.g. 12000000, I would On stackoverflow, user Christoph answers this with examples using the exponential notation,[1] i.e., ``` set format y '%.0tE%+T' ``` and one where (user defined) yticks' labels basically run by kB, MB, GB, TB, PB.[2] Though for the second one, gnuplot possibly offers a more compact approach than by addition of ``` set ytics 10 set mytics 10 set ytics add ( "1 kb" 1000, \ "10 kb" 10000, \ "100 kb" 100000,\ "1 mb" 1000000, \ "10 mb" 10000000,\ "100 mb" 100000000,\ "1 gb" 1000000000, \ "10 gb" 10000000000.0,\ "100 gb" 100000000000.0,\ "1 tb" 1000000000000.0, \ "10 tb" 10000000000000.0, \ "100 tb" 100000000000000.0, \ "1 pb" 1000000000000000.0, \ "10 pb" 10000000000000000.0 ) ``` as instruction. Based on the preview shared with simultaneous presence of lower-level (trace rjc; incal and lich) and higher-level data (trace solene), a plot substituting y by its transformation into lg(y) or sqrt(y) may be worth a consideration. [1] https://stackoverflow.com/questions/19569864/excluding-a-tic-number-in-scientific-format [2] https://stackoverflow.com/questions/23047927/showing-minor-tic-grid-in-gnuplot-with-manually-defined-major-tics |
|
From: James C. <cl...@jh...> - 2022-06-22 14:39:51
|
>>>>> "EB" == Emanuel Berg <in...@da...> writes: EB> I have 'set format y "%0.f"', so I get, e.g. 12000000, I would man 3 printf would be a useful doc to read. you might want to try "%0'.f" or "%'0.f" (whichever you find easier to read). -JimC -- James Cloos <cl...@jh...> OpenPGP: 0x997A9F17ED7DAEA6 |
|
From: Norwid B. <nb...@ya...> - 2022-06-22 10:02:51
|
Emanuel Berg <in...@da...> wrote: > How do I get a bright-on-theme? I did 'set term png background > rgb 'black'' but then how do I do everything else bright? Like "black", there is "white", i.e. an instruction like ``` set term pngcairo background rgb "white" ``` to expand all over the canvas*) equally is possible. *) If your aim is to alter the representation only within the plot, but not on the caption, legend, etc, you still could put a rectangle behind (back) the plot. As a verbose minimal working example: ``` set terminal pngcairo set output "test.png" set object 1 rect from graph 0, graph 0 to graph 1, graph 1 back set object 1 rect fc rgb "gray" fillstyle solid 1.0 plot sin(x) ``` With regards |
|
From: Emanuel B. <in...@da...> - 2022-06-22 07:15:19
|
How do I get a bright-on-theme? I did 'set term png background rgb 'black'' but then how do I do everything else bright? TIA https://dataswamp.org/~incal/hits/hits.dat https://dataswamp.org/~incal/hits/hits.gpi https://dataswamp.org/~incal/hits/hits.png -- underground experts united https://dataswamp.org/~incal |
635 messages has been excluded from this view by a project administrator.
