Menu
▾
▴
gnuplot-info — For questions and discussion about gnuplot
You can subscribe to this list here.
| 2003 |
Jan
|
Feb
|
Mar
|
Apr
|
May
|
Jun
|
Jul
|
Aug
|
Sep
|
Oct
(2) |
Nov
(2) |
Dec
|
|---|---|---|---|---|---|---|---|---|---|---|---|---|
| 2004 |
Jan
(3) |
Feb
(1) |
Mar
(2) |
Apr
(22) |
May
(52) |
Jun
(43) |
Jul
(36) |
Aug
(59) |
Sep
(37) |
Oct
(55) |
Nov
(39) |
Dec
(36) |
| 2005 |
Jan
(64) |
Feb
(40) |
Mar
(62) |
Apr
(58) |
May
(256) |
Jun
(77) |
Jul
(80) |
Aug
(39) |
Sep
(56) |
Oct
(36) |
Nov
(113) |
Dec
(68) |
| 2006 |
Jan
(43) |
Feb
(64) |
Mar
(69) |
Apr
(60) |
May
(71) |
Jun
(53) |
Jul
(63) |
Aug
(63) |
Sep
(76) |
Oct
(85) |
Nov
(82) |
Dec
(73) |
| 2007 |
Jan
(75) |
Feb
(82) |
Mar
(84) |
Apr
(104) |
May
(67) |
Jun
(101) |
Jul
(107) |
Aug
(138) |
Sep
(128) |
Oct
(106) |
Nov
(112) |
Dec
(112) |
| 2008 |
Jan
(94) |
Feb
(87) |
Mar
(146) |
Apr
(169) |
May
(75) |
Jun
(26) |
Jul
(26) |
Aug
(7) |
Sep
(18) |
Oct
(53) |
Nov
(42) |
Dec
(19) |
| 2009 |
Jan
(43) |
Feb
(39) |
Mar
(18) |
Apr
(45) |
May
(66) |
Jun
(87) |
Jul
(56) |
Aug
(41) |
Sep
(56) |
Oct
(139) |
Nov
(98) |
Dec
(88) |
| 2010 |
Jan
(81) |
Feb
(79) |
Mar
(83) |
Apr
(97) |
May
(124) |
Jun
(84) |
Jul
(53) |
Aug
(85) |
Sep
(89) |
Oct
(50) |
Nov
(98) |
Dec
(78) |
| 2011 |
Jan
(97) |
Feb
(74) |
Mar
(68) |
Apr
(54) |
May
(63) |
Jun
(59) |
Jul
(65) |
Aug
(58) |
Sep
(37) |
Oct
(40) |
Nov
(59) |
Dec
(35) |
| 2012 |
Jan
(16) |
Feb
(56) |
Mar
(63) |
Apr
(25) |
May
(48) |
Jun
(58) |
Jul
(20) |
Aug
(13) |
Sep
(43) |
Oct
(35) |
Nov
(20) |
Dec
(17) |
| 2013 |
Jan
(22) |
Feb
(11) |
Mar
(51) |
Apr
(34) |
May
(57) |
Jun
(27) |
Jul
(70) |
Aug
(30) |
Sep
(38) |
Oct
(53) |
Nov
(40) |
Dec
(25) |
| 2014 |
Jan
(26) |
Feb
(35) |
Mar
(60) |
Apr
(12) |
May
(17) |
Jun
(15) |
Jul
(9) |
Aug
(18) |
Sep
(46) |
Oct
(18) |
Nov
(19) |
Dec
(15) |
| 2015 |
Jan
(17) |
Feb
(28) |
Mar
(21) |
Apr
(54) |
May
(36) |
Jun
(8) |
Jul
(30) |
Aug
(13) |
Sep
(3) |
Oct
(28) |
Nov
(3) |
Dec
(3) |
| 2016 |
Jan
(11) |
Feb
(9) |
Mar
(29) |
Apr
(10) |
May
(8) |
Jun
(5) |
Jul
(50) |
Aug
(57) |
Sep
(13) |
Oct
(5) |
Nov
(17) |
Dec
(11) |
| 2017 |
Jan
(3) |
Feb
(23) |
Mar
(16) |
Apr
(7) |
May
(15) |
Jun
(12) |
Jul
(48) |
Aug
(15) |
Sep
(3) |
Oct
(20) |
Nov
(28) |
Dec
(21) |
| 2018 |
Jan
(13) |
Feb
(21) |
Mar
(21) |
Apr
(7) |
May
(3) |
Jun
(7) |
Jul
(27) |
Aug
(38) |
Sep
(4) |
Oct
(30) |
Nov
(22) |
Dec
|
| 2019 |
Jan
(5) |
Feb
(16) |
Mar
(1) |
Apr
(9) |
May
(7) |
Jun
(20) |
Jul
(13) |
Aug
(3) |
Sep
(2) |
Oct
(2) |
Nov
(2) |
Dec
(4) |
| 2020 |
Jan
(6) |
Feb
(11) |
Mar
(1) |
Apr
(18) |
May
(4) |
Jun
(5) |
Jul
(12) |
Aug
(1) |
Sep
(3) |
Oct
(7) |
Nov
(1) |
Dec
(17) |
| 2021 |
Jan
(1) |
Feb
(11) |
Mar
(16) |
Apr
(6) |
May
(5) |
Jun
(1) |
Jul
(1) |
Aug
(2) |
Sep
(8) |
Oct
(10) |
Nov
(4) |
Dec
(4) |
| 2022 |
Jan
(9) |
Feb
(35) |
Mar
(4) |
Apr
|
May
(3) |
Jun
(49) |
Jul
(11) |
Aug
|
Sep
(5) |
Oct
(2) |
Nov
(16) |
Dec
(13) |
| 2023 |
Jan
|
Feb
(8) |
Mar
(3) |
Apr
|
May
(8) |
Jun
|
Jul
(5) |
Aug
|
Sep
|
Oct
(2) |
Nov
|
Dec
(2) |
| 2024 |
Jan
(6) |
Feb
(9) |
Mar
|
Apr
(26) |
May
(24) |
Jun
|
Jul
(4) |
Aug
(2) |
Sep
(1) |
Oct
(10) |
Nov
(9) |
Dec
|
| 2025 |
Jan
|
Feb
(22) |
Mar
|
Apr
(1) |
May
|
Jun
|
Jul
|
Aug
|
Sep
(1) |
Oct
(1) |
Nov
|
Dec
(4) |
| 2026 |
Jan
|
Feb
(24) |
Mar
(20) |
Apr
(13) |
May
|
Jun
|
Jul
|
Aug
|
Sep
|
Oct
|
Nov
|
Dec
|
|
From: Peter R. <p.r...@sh...> - 2022-11-02 09:31:09
|
Ummm.... Would the OP's problem be more elegantly solved with a small
Python script. Or even using Excel to pre-process the data file?
(Reinhart & Rogoff notwithstanding...)

Peter

On 02/11/2022 05:02, Ethan Merritt wrote:
> Underflow confirmed.
>
> The Faddeeva function is exp(-z^2) * erfc(-i*z)
>
> Calculation of exp(-z^2) underflows to zero at about z = 27.
> Gnuplot's own exp function knows to ignore the floating point
> exception that is generated and just return zero.
> But the implementation used by the Faddeeva function in libcerf
> doesn't do this. It leaves the ERANGE error active.
>
> I don't have an immediate fix for this in gnuplot.
>
> The libcerf library does provide a separate function
> im_w_of_x(x) that would calculate the imaginary part
> without triggering an underflow, but that only helps if
> the calling program already knows there will be an underflow
> and calls the special case instead of the generic routine.
> Gnuplot doesn't currently know to do this.
>
> 	Ethan
>
>
> On Tuesday, 1 November 2022 18:02:33 PDT Ethan Merritt wrote:
>> On Tuesday, 1 November 2022 14:54:01 PDT Patrick Dupre wrote:
>>> Hello,
>>>
>>> Setting
>>> fcn(x,g,G)=-imag(1/(x+I*g)*faddeeva(x/G)
>>>
>>> plot [-30:30] fcn(x,0.01,1)
>>>
>>> provides
>>> nan from values less than -27.28 and more than 27.28
>>> There is not reason for that
>>> The value are small, but not very small
>>> slightly less than
>>> -0.0007586274478
>>>
>>> Any idea?
>>> Good question.
>>> Something in the cerf library is setting a range error (ERANGE)
>>> "Math result not representable".  Possibly this is due to
>>> underflow of the real component, which we could ignore, but that is
>>> only speculation at this point.  Note the result
>>>    gnuplot> print faddeeva(27.)
>>>    {2.50797207889417e-317, 0.0209102719931009}
>>> which indicates that the real component has reached the smallest
>>> representable IEEE double float value.
>>>
>>> I will investigate further.
>>>
>>> 	Ethan
>>>
>
>
>
>
> _______________________________________________
> gnuplot-info mailing list
> gnu...@li...
> Membership management via: https://lists.sourceforge.net/lists/listinfo/gnuplot-info
|
|
From: Ethan M. <eam...@gm...> - 2022-11-02 05:02:16
|
Underflow confirmed.

The Faddeeva function is exp(-z^2) * erfc(-i*z)

Calculation of exp(-z^2) underflows to zero at about z = 27.
Gnuplot's own exp function knows to ignore the floating point
exception that is generated and just return zero.
But the implementation used by the Faddeeva function in libcerf
doesn't do this. It leaves the ERANGE error active.

I don't have an immediate fix for this in gnuplot.

The libcerf library does provide a separate function
im_w_of_x(x) that would calculate the imaginary part
without triggering an underflow, but that only helps if
the calling program already knows there will be an underflow
and calls the special case instead of the generic routine.
Gnuplot doesn't currently know to do this.

	Ethan


On Tuesday, 1 November 2022 18:02:33 PDT Ethan Merritt wrote:
> On Tuesday, 1 November 2022 14:54:01 PDT Patrick Dupre wrote:
> > Hello,
> >
> > Setting
> > fcn(x,g,G)=-imag(1/(x+I*g)*faddeeva(x/G)
> >
> > plot [-30:30] fcn(x,0.01,1)
> >
> > provides
> > nan from values less than -27.28 and more than 27.28
> > There is not reason for that
> > The value are small, but not very small
> > slightly less than
> > -0.0007586274478
> >
> > Any idea?
>
> Good question.
> Something in the cerf library is setting a range error (ERANGE)
> "Math result not representable".  Possibly this is due to
> underflow of the real component, which we could ignore, but that is
> only speculation at this point.  Note the result
>   gnuplot> print faddeeva(27.)
>   {2.50797207889417e-317, 0.0209102719931009}
> which indicates that the real component has reached the smallest
> representable IEEE double float value.
>
> I will investigate further.
>
> 	Ethan
>
|
|
From: Ethan M. <eam...@gm...> - 2022-11-02 01:02:44
|
On Tuesday, 1 November 2022 14:54:01 PDT Patrick Dupre wrote:
> Hello,
>
> Setting
> fcn(x,g,G)=-imag(1/(x+I*g)*faddeeva(x/G)
>
> plot [-30:30] fcn(x,0.01,1)
>
> provides
> nan from values less than -27.28 and more than 27.28
> There is not reason for that
> The value are small, but not very small
> slightly less than
> -0.0007586274478
>
> Any idea?

Good question.
Something in the cerf library is setting a range error (ERANGE)
"Math result not representable".  Possibly this is due to
underflow of the real component, which we could ignore, but that is
only speculation at this point.  Note the result
  gnuplot> print faddeeva(27.)
  {2.50797207889417e-317, 0.0209102719931009}
which indicates that the real component has reached the smallest
representable IEEE double float value.

I will investigate further.

	Ethan

>
> Thank
> ===========================================================================
>  Patrick DUPRÉ                                 | | email: pd...@gm...
>  Laboratoire interdisciplinaire Carnot de Bourgogne
>  9 Avenue Alain Savary, BP 47870, 21078 DIJON Cedex FRANCE
>  Tel: +33 (0)380395988                    | | Room# D114A
> ===========================================================================
>
>
>
> _______________________________________________
> gnuplot-info mailing list
> gnu...@li...
> Membership management via: https://lists.sourceforge.net/lists/listinfo/gnuplot-info
>
|
|
From: Patrick D. <pd...@gm...> - 2022-11-01 21:54:11
|
Hello, Setting fcn(x,g,G)=-imag(1/(x+I*g)*faddeeva(x/G) plot [-30:30] fcn(x,0.01,1) provides nan from values less than -27.28 and more than 27.28 There is not reason for that The value are small, but not very small slightly less than -0.0007586274478 Any idea? Thank =========================================================================== Patrick DUPRÉ | | email: pd...@gm... Laboratoire interdisciplinaire Carnot de Bourgogne 9 Avenue Alain Savary, BP 47870, 21078 DIJON Cedex FRANCE Tel: +33 (0)380395988 | | Room# D114A =========================================================================== |
|
From: Alan C. <ala...@gm...> - 2022-11-01 21:43:31
|
As summation like for calculus? On 11/1/22, theozh <th...@gm...> wrote: > maybe something like this...? > > mySum(xmin,xmax,N) = sum[i=0:N-1] (x0=xmin+real(xmax-xmin)/(N-1)*i,f(x0)) > > f(x) = x > print mySum(1,100,100) > > f(x) = x**2 > print mySum(-10,10,2001) > > Results: 5050.0 and 66766.7 > > You need real() to avoid gnuplot's integer division. > Alternatively, you have to ensure that xmin or xmax are floating point > numbers. > > Am 01.11.2022 um 20:55 schrieb Patrick Dupre: >> set samples 2001 >> >> f(x)= .. >> >> I wish to get the sum of f(x) from [-10:10] >> > > > _______________________________________________ > gnuplot-info mailing list > gnu...@li... > Membership management via: > https://lists.sourceforge.net/lists/listinfo/gnuplot-info > -- ------------- Education is contagious. |
|
From: theozh <th...@gm...> - 2022-11-01 21:35:59
|
maybe something like this...? mySum(xmin,xmax,N) = sum[i=0:N-1] (x0=xmin+real(xmax-xmin)/(N-1)*i,f(x0)) f(x) = x print mySum(1,100,100) f(x) = x**2 print mySum(-10,10,2001) Results: 5050.0 and 66766.7 You need real() to avoid gnuplot's integer division. Alternatively, you have to ensure that xmin or xmax are floating point numbers. Am 01.11.2022 um 20:55 schrieb Patrick Dupre: > set samples 2001 > > f(x)= .. > > I wish to get the sum of f(x) from [-10:10] > |
|
From: Patrick D. <pd...@gm...> - 2022-11-01 19:55:29
|
set samples 2001 f(x)= .. I wish to get the sum of f(x) from [-10:10] =========================================================================== Patrick DUPRÉ | | email: pd...@gm... Laboratoire interdisciplinaire Carnot de Bourgogne 9 Avenue Alain Savary, BP 47870, 21078 DIJON Cedex FRANCE Tel: +33 (0)380395988 | | Room# D114A =========================================================================== > Sent: Tuesday, November 01, 2022 at 8:34 PM > From: "theozh" <th...@gm...> > To: gnu...@li... > Subject: Re: [Gnuplot-info] sum > > What is your x-range and x-step? Only integer numbers? > Can you please give an example? > Have you checked "help sum"? > > > _______________________________________________ > gnuplot-info mailing list > gnu...@li... > Membership management via: https://lists.sourceforge.net/lists/listinfo/gnuplot-info > |
|
From: theozh <th...@gm...> - 2022-11-01 19:35:00
|
What is your x-range and x-step? Only integer numbers? Can you please give an example? Have you checked "help sum"? |
|
From: Patrick D. <pd...@gm...> - 2022-11-01 19:25:30
|
Hello, I have a function f(x) How can I get the sum of all the values calculated by this function? Thank. =========================================================================== Patrick DUPRÉ | | email: pd...@gm... Laboratoire interdisciplinaire Carnot de Bourgogne 9 Avenue Alain Savary, BP 47870, 21078 DIJON Cedex FRANCE Tel: +33 (0)380395988 | | Room# D114A =========================================================================== |
|
From: Patrick D. <pd...@gm...> - 2022-10-24 17:23:55
|
Hello, Can I use x2range with splot ? Thank =========================================================================== Patrick DUPRÉ | | email: pd...@gm... Laboratoire interdisciplinaire Carnot de Bourgogne 9 Avenue Alain Savary, BP 47870, 21078 DIJON Cedex FRANCE Tel: +33 (0)380395988 | | Room# D114A =========================================================================== |
|
From: Debostuti G. <deb...@gm...> - 2022-10-17 11:30:46
|
Dear Gnuplot Community I am using the following command to plot my data with a set of variable colors. splot "Params.dat" using 3:6:1 with points pointtype 7 pointsize 1 lc variable linewidth 5 I had two questions regarding this: 1. How do I show a legend on the graph that indicates the value each color signifies, something like what we get using cbrange and palette? 2. How do I set the colors to particular ones instead of the default colors specified by lc variable? Thank you -- Debostuti Ghosh Dastidar Research Associate PDB-India |
|
From: Ethan M. <eam...@gm...> - 2022-09-16 17:27:06
|
On Friday, 16 September 2022 05:21:16 PDT Geoff Kaniuk wrote:
> Thank you all for the swift replies. This made me realise that my
> looped plot example produces separate plots for each array, but I wanted
> all curves in 1 plot.
>
> Using the eval clue I have come up with a solution looking like this:
>
> STEP1. create a function curves(n)
> 	to generate the string  "ab1 w lp, ab2 w lp"
> 	( I wonder if this what Alan Corey meant by search & replace)
>
> STEP2.
> 	curves = curves(2)
> 	plotcurves = "plot ".curves
> 	eval(plotcurves)
>
> Using sprintf to get plotcurves also worked. One slight issue is that I
> had missed a space after the comma separating the plot elements. So  the
> generated string  "ab1 w lp,ab2 w lp" failed, with plot trying to treat
> it as the name of a single file. However plot ab1 w lp,ab2 w lp is fine.
>
> Although this is a solution for a handful of arrays, is this really the
> only way?

I don't think you can do better than that in version 5.2.

The development version of gnuplot supports a larger set of array
operations including treating them as unitary variables for the
purpose of passing an array to, or returning an array from, a function.

Here is a script that works in 5.5 but not in 5.2:

###
array ab1 = [1,1,1]
array ab2 = [2,2]
array ab5 = [5,5]
array ab67 = [67,67]
list = ""
do for [i = 1:99] {
    name = sprintf("ab%d",i)
    if (exists(name)) {
        list = list." ".name
    }
}
print "Now I will plot: ", list
plot for [name in list] value(name) with lp
###

Version 5.2 understands what that script attempts to do but
prints an error "unsupported array operation".

	Ethan
|
|
From: Geoff K. <ge...@ka...> - 2022-09-16 12:21:35
|
Thank you all for the swift replies. This made me realise that my
looped plot example produces separate plots for each array, but I wanted
all curves in 1 plot.

Using the eval clue I have come up with a solution looking like this:

STEP1. create a function curves(n)
	to generate the string  "ab1 w lp, ab2 w lp"
	( I wonder if this what Alan Corey meant by search & replace)

STEP2.
	curves = curves(2)
	plotcurves = "plot ".curves
	eval(plotcurves)

Using sprintf to get plotcurves also worked. One slight issue is that I
had missed a space after the comma separating the plot elements. So  the
generated string  "ab1 w lp,ab2 w lp" failed, with plot trying to treat
it as the name of a single file. However plot ab1 w lp,ab2 w lp is fine.

Although this is a solution for a handful of arrays, is this really the
only way?

Geoff
33 Ashbury Close, Cambridge CB1 3RW 01223 710582

On 15/09/2022 21:37, Ethan Merritt wrote:
> On Thursday, 15 September 2022 11:06:44 PDT Geoff Kaniuk wrote:
>> Dear gnuplot,
>>
>> I would like to plot a sequence of arrays.
>>
>> For example, I have a script:
>>
>> plot-arrays.gp
>> # TEST PLOT ARRAYS
>> reset session
>>
>> array ab1[3] = [ 1.1, 1.2, 1.3 ]
>> array ab2[3] = [ 2.1, 2.2, 2.3 ]
>>
>> plot ab1 w lp, ab2 w lp
>>
>> abname(i)=sprintf("%s%d", "ab", i)
>>
>> do for [k=1:2]{ abk = abname(k); plot abk w lp }
>> # END
>>
>> The first plot command works fine. But I have a large number of such
>> arrays and would like to proceed as in the second looped command.
>
> See "help eval".
> You want something like this
>
>    do for [k=1:N] {
>      command = sprintf("plot ab%d w lp", k)
>      eval(command);
>    }
>
> 	Ethan
>
>
>
|
|
From: Ethan M. <eam...@gm...> - 2022-09-15 20:37:59
|
On Thursday, 15 September 2022 11:06:44 PDT Geoff Kaniuk wrote:
> Dear gnuplot,
>
> I would like to plot a sequence of arrays.
>
> For example, I have a script:
>
> plot-arrays.gp
> # TEST PLOT ARRAYS
> reset session
>
> array ab1[3] = [ 1.1, 1.2, 1.3 ]
> array ab2[3] = [ 2.1, 2.2, 2.3 ]
>
> plot ab1 w lp, ab2 w lp
>
> abname(i)=sprintf("%s%d", "ab", i)
>
> do for [k=1:2]{ abk = abname(k); plot abk w lp }
> # END
>
> The first plot command works fine. But I have a large number of such
> arrays and would like to proceed as in the second looped command.

See "help eval".
You want something like this

  do for [k=1:N] {
    command = sprintf("plot ab%d w lp", k)
    eval(command);
  }

	Ethan
|
|
From: Geoff K. <ge...@ka...> - 2022-09-15 19:22:23
|
Dear gnuplot,

I would like to plot a sequence of arrays.

For example, I have a script:

plot-arrays.gp
# TEST PLOT ARRAYS
reset session

array ab1[3] = [ 1.1, 1.2, 1.3 ]
array ab2[3] = [ 2.1, 2.2, 2.3 ]

plot ab1 w lp, ab2 w lp

abname(i)=sprintf("%s%d", "ab", i)

do for [k=1:2]{ abk = abname(k); plot abk w lp }
# END

The first plot command works fine. But I have a large number of such
arrays and would like to proceed as in the second looped command.

But as things stand, the variable abk is treated as a file name and I
get the message:
gnuplot> call "plot-arrays.gp"
   "plot-arrays.gp" line 11: warning: Cannot find or open file "ab1"
   "plot-arrays.gp" line 11: No data in plot

I have experimented with macro substitution but not made any progress.

Is it possible to plot an array sequence?

I am using gnuplot 5.2 patchlevel 6, running under Debian Buster

--
Geoff

33 Ashbury Close, Cambridge CB1 3RW 01223 710582
|
|
From: Valerio B. <ns...@su...> - 2022-09-06 17:23:40
|
Hi activists of gnuplot, I'm a Wikidata volunteer and I'm trying to plot software licenses on a timeline. Weird example: https://w.wiki/5fr4 The only info that I'm missing is: When was the "gnuplot license" first invented / published? Do you know the date? Then: Can you be so kind to write this information somewhere on your website, in order to link that as source? Thank you so much for your help! -boz -- [[User:Valerio Bozzolan]] E-mail sent from Evolution from a random GNU/Linux distribution, delivered from my Postfix mailserver. Have fun with software freedom! |
|
From: Emanuel B. <in...@da...> - 2022-07-22 02:40:39
|
Jeremy Nicoll - ml gnuplot wrote: > I'm not sure if you got the point I was trying to make. > > If someone tries to read through your older posts following > the successive changes you made to your code, they cannot > see all the different pictures that you made, because each > newer one overwrote the older ones. > > I'm happy that you managed to get the graph looking how you > wanted, but sad that the process isn't so easy for other > people to understand. I understood, don't know if this qualifies as a real problem tho, but if and when I do this again I'll maybe use a filename scheme so that plot-revenge-2022-07-22.png would indicate today's version. -- underground experts united https://dataswamp.org/~incal |
|
From: Jeremy N. - ml g. <jn....@wi...> - 2022-07-11 10:33:01
|
On 2022-07-11 09:40, Norwid Behrnd via gnuplot-info wrote: > Jeremy Nicoll wrote: > >> If someone tries to read through your older posts following the >> successive changes you made to your code, they cannot see all >> the different pictures that you made, because each newer one >> overwrote the older ones. > @Jeremy > My interpretation of you reply is you recommend snippets of code > shared here should be both complete as in «all the relevant > instructions to demonstrate the issue» .and. self sufficient for > a test run, i.e. to include a minimal set of data to process. In > other words, to include gnuplot's datablocks (`$data`) as in e.g., > > ```gnuplot script > $data << EOD ... Yes! I presume that gnuplot's output isn't meant to vary much across different OSes, but presumably there can be platform differences not least in the fonts available. So although in theory anyone can test someone-else's code on their own system, it might not follow that weird results that one person gets will also happen for everyone else. That's why I thought that if URLs are given to an OP's image(s) it would be better if different images had different URLs. -- Jeremy Nicoll - my opinions are my own |
|
From: Norwid B. <nb...@ya...> - 2022-07-11 08:40:22
|
Jeremy Nicoll wrote: > If someone tries to read through your older posts following the > successive changes you made to your code, they cannot see all > the different pictures that you made, because each newer one > overwrote the older ones. @Jeremy My interpretation of you reply is you recommend snippets of code shared here should be both complete as in «all the relevant instructions to demonstrate the issue» .and. self sufficient for a test run, i.e. to include a minimal set of data to process. In other words, to include gnuplot's datablocks (`$data`) as in e.g., ```gnuplot script $data << EOD 1 2 2 4.5 3 3 4 -1.2 5 0 EOD set terminal pngcairo set output "test.png" set grid plot "$data" w lp pt 2 lc "blue" title "par example" ``` or, considering only a dozen of records of Emanuel's log ```gnuplot script $data << EOD 11814601 737184 610310 13198 4223 1885 11830440 737790 611265 13295 4239 1904 11846530 739535 612274 13396 4264 1918 11861902 742324 613332 13513 4285 1931 11877902 743061 614346 13551 4301 1992 11894437 744473 615366 13609 4318 2290 11910270 745453 616369 13731 9014 4356 11925807 745957 617127 13840 9725 4372 11941696 746489 617887 13952 10055 4387 11958357 748936 618940 14061 10281 4425 11975490 749952 619995 14129 10342 4440 EOD set term png background rgb "black" set out "check.png" set tics font "verdana,10" set format x "%s" timedate set xtics 3,7 set xrange [1:] noextend set format y "%.0s%c" set logscale y set yrange[1000:1e9] set grid lc "yellow" set border lc "gray" set key outside top right spacing 1.4 tc "white" font "verdana,10" horizontal array Cols = ["cyan", "magenta", "yellow", "green", "white", "red"] data= "$data" plot for [i=1:*] \ data u ($0+1):i w l lc rgb Cols[(i % 6) + 1] lw 2 t columnhead ``` @moderators of the mailing list Perhaps the suggest to include small datablocks to render MWE easier to replicate could be included in one of the mails when subscribing to the list. |
|
From: Jeremy N. - ml g. <jn....@wi...> - 2022-07-10 20:01:03
|
On 2022-07-10 04:30, Emanuel Berg wrote: > Jeremy Nicoll - ml gnuplot wrote: > >> When I post images for other people to view (not yet on this >> list) I post them with date & time-stamped names & generally >> leave them online for several years... > > I saved one, have a look: > https://dataswamp.org/~incal/hits/hits-vfork.png > > LOL > > But the correct one now looks like this, I think its correct, > looks cool, and is automated until 2023 at least :) > > https://dataswamp.org/~incal/hits/hits.png I'm not sure if you got the point I was trying to make. If someone tries to read through your older posts following the successive changes you made to your code, they cannot see all the different pictures that you made, because each newer one overwrote the older ones. I'm happy that you managed to get the graph looking how you wanted, but sad that the process isn't so easy for other people to understand. -- Jeremy Nicoll - my opinions are my own |
|
From: Emanuel B. <in...@da...> - 2022-07-10 03:31:09
|
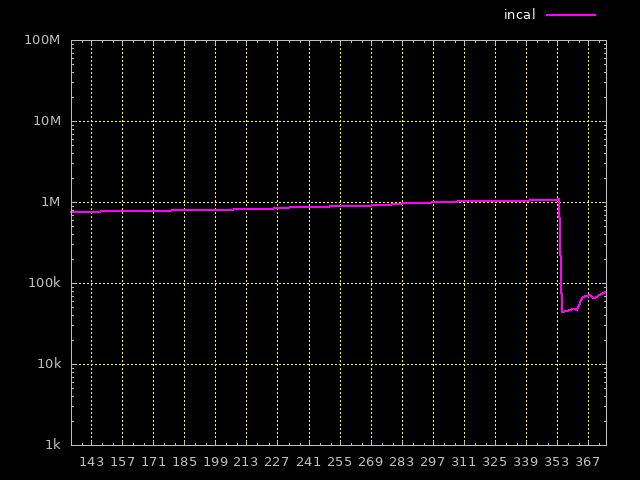
Jeremy Nicoll - ml gnuplot wrote: > When I post images for other people to view (not yet on this > list) I post them with date & time-stamped names & generally > leave them online for several years... I saved one, have a look: https://dataswamp.org/~incal/hits/hits-vfork.png LOL But the correct one now looks like this, I think its correct, looks cool, and is automated until 2023 at least :) https://dataswamp.org/~incal/hits/hits.png Or tell me what you think can be improved ... I like forfinements. Err, "hit me"? Source: https://dataswamp.org/~incal/emacs-init/piles.el https://dataswamp.org/~incal/hits/piles-all https://dataswamp.org/~incal/hits/hits.gpi |
|
From: Jeremy N. - ml g. <jn....@wi...> - 2022-07-08 16:22:32
|
On 2022-07-08 05:30, Emanuel Berg wrote: > What happened to the colors? I'm using the array in an > incorrect way. > # this file: > # https://dataswamp.org/~incal/hits/hits.gpi > # > # the graph: > # https://dataswamp.org/~incal/hits/hits.png Every time you post you seem to use the same URLs for the sample data (which is maybe ok if it never changes) and image (which presumably does change through your successive experiments). But that means that someone reading through successive posts you made cannot see what your successive images looked like, just the most recent one. Bear in mind that not everyone reading your posts will necessarily read them on the day you post them. When I post images for other people to view (not yet on this list) I post them with date & time-stamped names & generally leave them online for several years... -- Jeremy Nicoll - my opinions are my own |
|
From: Emanuel B. <in...@da...> - 2022-07-08 07:46:16
|
hchiPer wrote: > Add rgb befor the color name: > > plot for [i=1:*] \ > data u ($0+1):i w l lc rgb Cols[(i % 6) + 1] lw 2 > t columnhead Sweet, that did it! Merci! https://dataswamp.org/~incal/hits/hits.png |
|
From: hchiPer <hc...@gm...> - 2022-07-08 07:08:50
|
Add rgb befor the color name: plot for [i=1:*] \ data u ($0+1):i w l lc rgb Cols[(i % 6) + 1] lw 2 t columnhead Le 8/07/22 à 06:30, Emanuel Berg a écrit : > plot for [i=1:*] \ > data u ($0+1):i w l lc Cols[(i % 6) + 1] lw 2 t columnhead |
|
From: Emanuel B. <in...@da...> - 2022-07-08 04:35:18
|
What happened to the colors? I'm using the array in an incorrect way. #! /usr/local/bin/gnuplot # # this file: # https://dataswamp.org/~incal/hits/hits.gpi # # the graph: # https://dataswamp.org/~incal/hits/hits.png reset set term png background rgb "black" set out "/home/incal/public_html/hits/hits.png" set tics font "verdana,10" set format x "%s" timedate set xtics 3,7 set xrange [147:] noextend set format y "%.0s%c" set logscale y set yrange[1000:1e9] set grid lc "yellow" set border lc "gray" set key outside top right spacing 1.4 tc "white" font "verdana,10" horizontal array Cols = ["cyan", "magenta", "yellow", "green", "white", "red"] data="/home/incal/public_html/hits/hits.dat" plot for [i=1:*] \ data u ($0+1):i w l lc Cols[(i % 6) + 1] lw 2 t columnhead -- underground experts united https://dataswamp.org/~incal |
635 messages has been excluded from this view by a project administrator.
